> For the complete documentation index, see [llms.txt](https://help.verkada.com/llms.txt). Markdown versions of documentation pages are available by appending `.md` to page URLs; this page is available as [Markdown](https://help.verkada.com/verkada-cameras/ja/fen-xi/camera-stats/device-stats-dashboard.md).
# デバイス統計ダッシュボード
デバイス分析を表示し、フリートの性能を把握する方法を学びます
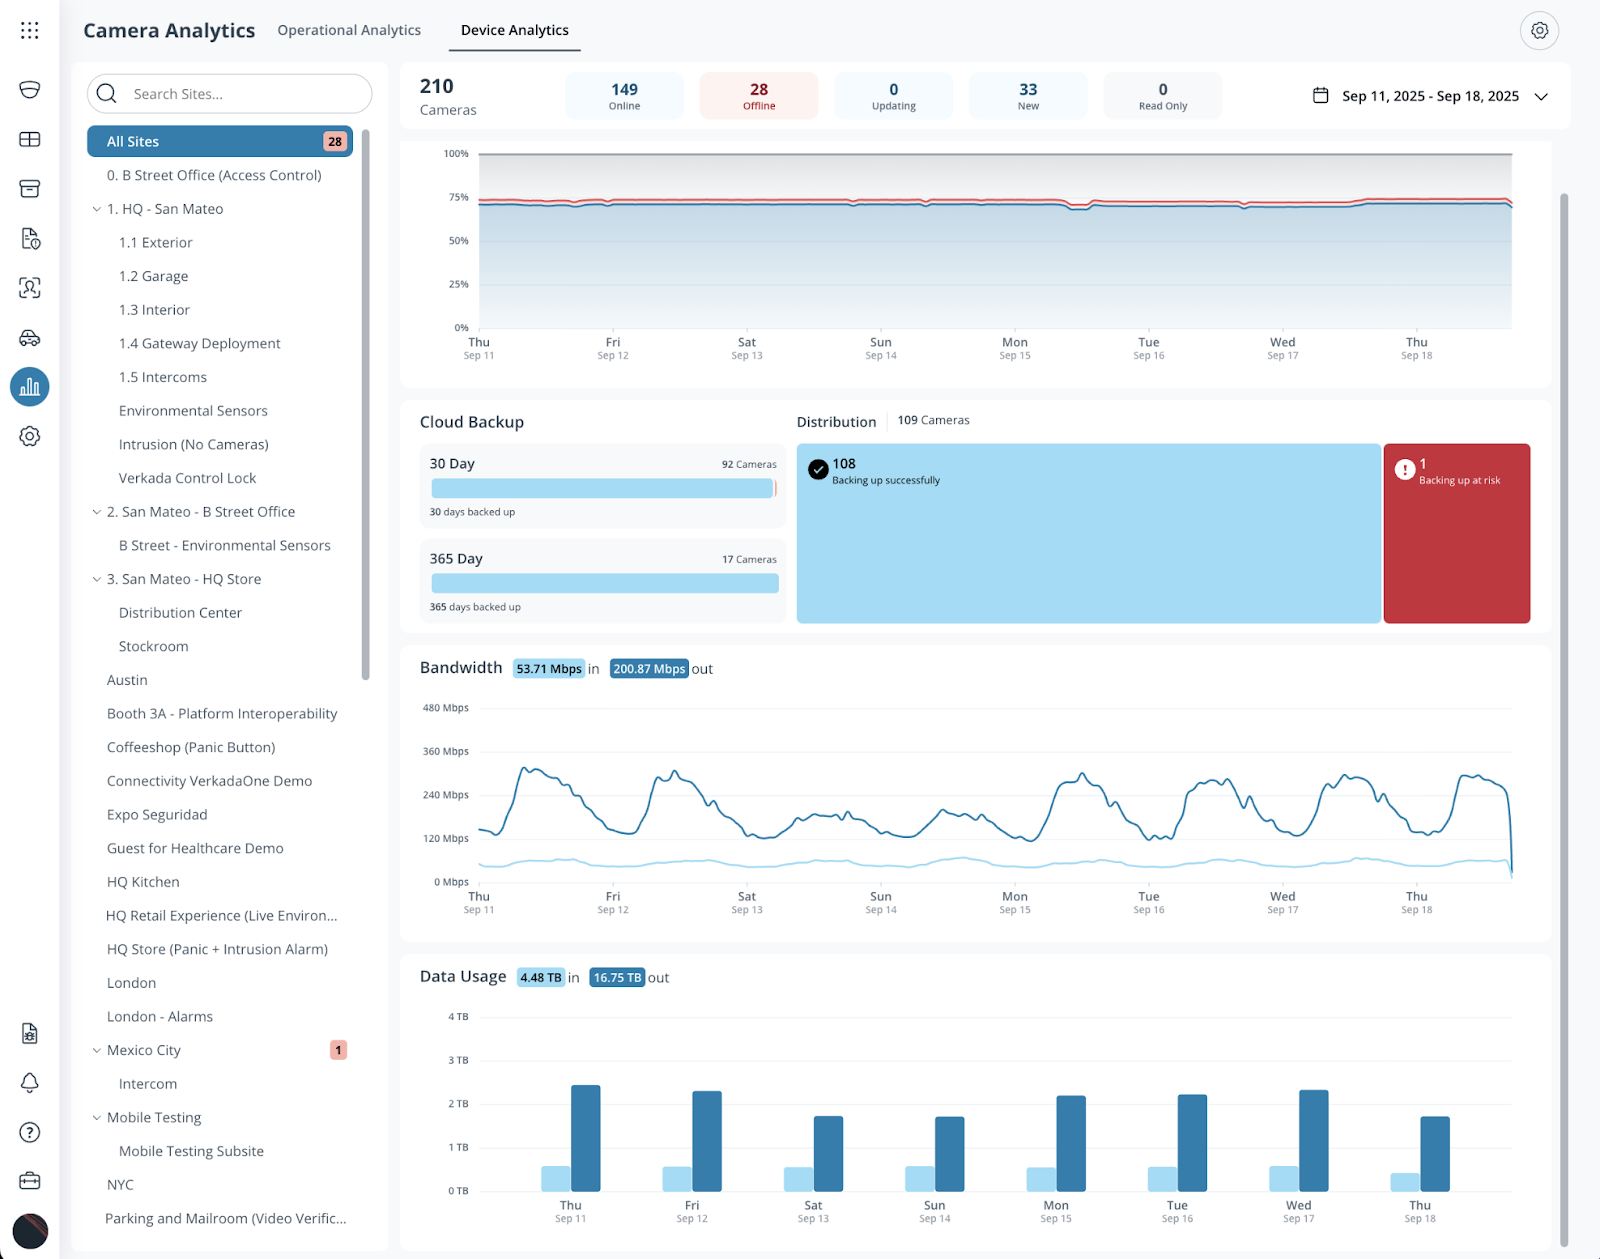
カメラ統計ダッシュボードでは、組織全体のカメラの状態、パフォーマンス、データ使用量をモニターできます。
***
## デバイス分析を表示
{% stepper %}
{% step %}
**Verkada Command で、\[All Products] > \[Cameras] に移動します。**
{% endstep %}
{% step %}
**左側のナビゲーションで、\[分析] > \[デバイス統計] を選択します。**
{% endstep %}
{% step %}
**左側のナビゲーションで、分析を表示するサイトを選択します。**
{% endstep %}
{% endstepper %}
{% hint style="info" %}
カメラページを開き、次を選択することで、1台のカメラのデバイス分析を表示できます  **統計**.
{% endhint %}
***
## ダッシュボードの概要
メインダッシュボードには、カメラシステムの概要が表示されます。
### サマリーメトリクスバー
ダッシュボード上部のサマリーメトリクスバーには、選択したサイト内のすべてのカメラの現在の状態が表示されます:
* **オンライン** – 現在接続され、オンラインのカメラ
* **オフライン** – ネットワークに接続されていないカメラ
* **更新中** – ファームウェアを更新中のカメラ
* **新規** – 設定は完了しているが、まだオンラインになっていないカメラ
* **読み取り専用** – 読み取り専用モードのカメラ
* **除外済み** – 分析から除外されたカメラ
任意のメトリクスボックスをクリックすると、そのカテゴリのカメラの詳細リストを表示できます。
### サイトと日付のフィルター
* **サイトセレクター** – 左側のサイドバーでサイトを選択します。オーガナイゼーション' 管理者は、既定で全サイトの集計データを表示できます。特定のサイトをクリックします(その場所の分析を絞り込むために。
* **期間選択** – 右上のカレンダーアイコンをクリックして、ダッシュボード全体のデータのカスタム期間を選択します。
### 分析グラフ
分析グラフでは、選択した日付範囲におけるカメラのパフォーマンスと使用状況を表示します。任意のポイントにカーソルを合わせると、詳細データを表示できます。
* **稼働時間** – 時間の経過に伴うオンライン、オフライン、または停止中のカメラの割合を表示します
* **クラウドバックアップ** – クラウドバックアップが有効なカメラの数と、その保持期間の分布(例:30日、365日)を表示します。帯域幅の制限がバックアップ処理に影響する場合、黄色で強調表示されたカメラには「要注意」と表示されます。
* **帯域幅** – カメラが使用する総ネットワーク帯域幅(Mbps)を表示します
* **データ使用量** – 1日あたりの総帯域幅使用量を表示します
### 個々のカメラの詳細を表示
{% stepper %}
{% step %}
**Verkada Command で、\[All Products] > \[Cameras] に移動します。**
{% endstep %}
{% step %}
**左側のナビゲーションで、\[分析] > \[デバイス統計] を選択します。**
{% endstep %}
{% step %}
**上部でメトリクスボックスを選択すると、そのカテゴリのカメラ一覧が開きます。**
a. 一覧からカメラを選択します。\
b. 右側で、そのカメラの稼働時間、帯域幅、データ使用量、モーション分析を表示します。\
c. 左上で、次を使用します **期間** ドロップダウンで期間を絞り込みます(例: *過去7日間* または *過去30日間*).
{% endstep %}
{% endstepper %}
### 分析からカメラを除外する
保守中、一時的に設置されている、または現在のモニタリングに関連しない場合は、カメラを分析から除外します。
{% stepper %}
{% step %}
**Verkada Command で、\[All Products] > \[Cameras] に移動します。**
{% endstep %}
{% step %}
**左側のナビゲーションで、\[分析] > \[デバイス統計] を選択します。**
{% endstep %}
{% step %}
**左上で、次をクリックします** :gear:**.**
a. の横の **除外されたカメラ**が表示されない場合は、 **選択**。\
b. 除外するカメラを選択します。選択したカメラにはチェックマークが表示されます。\
c. クリックします **保存**.
{% endstep %}
{% endstepper %}
除外されたカメラは、次の下に表示されます **除外済み** メインダッシュボードのカテゴリに表示され、分析には含まれません。データを表示するには、次をクリックします **除外済み** メトリクスボックス。
---
# Agent Instructions
This documentation is published with GitBook. GitBook is the documentation platform designed so that both humans and AI agents can read, navigate, and reason over technical content effectively. Learn more at gitbook.com.
## Querying This Documentation
If you need additional information that is not directly available in this page, you can query the documentation by asking a question.
Perform an HTTP GET request on the following URL with the `ask` and `goal` query parameters:
```
GET https://help.verkada.com/verkada-cameras/ja/fen-xi/camera-stats/device-stats-dashboard.md?ask=&goal=
```
`ask` is the immediate question: it should be specific, self-contained, and written in natural language.
`goal` is what the user is ultimately trying to achieve, the reason they need the answer. Sharing it helps GitBook give you a better, more relevant answer. A goal is most helpful when it describes the outcome the user wants rather than restating the question. For example, with `ask=how do I create an API token`, a goal like `automate deployments from our CI pipeline` lets GitBook tailor the answer to that use case.
The response will contain a direct answer to the question and relevant excerpts and sources from the documentation.
Use this mechanism when the answer is not explicitly present in the current page, you need clarification or additional context, or you want to retrieve related documentation sections.