> For the complete documentation index, see [llms.txt](https://help.verkada.com/llms.txt). Markdown versions of documentation pages are available by appending `.md` to page URLs; this page is available as [Markdown](https://help.verkada.com/verkada-cameras/ja/fen-xi/camera-stats.md).
# カメラ統計
デバイス分析を確認し、カメラの性能を把握します
カメラ統計を使用して、一定期間にわたるこれらの機能の傾向を確認できます。
* カメラ稼働率
* クラウドバックアップ
* 帯域幅の消費量
* データ使用量
* モーションのアクティビティ
***
## カメラ統計をモニターする
{% stepper %}
{% step %}
**Verkada Command で、\[All Products] > \[Cameras] に移動します。**
{% endstep %}
{% step %}
**カメラを選択して、そのライブカメラのストリーミングする映像を表示し、カメラ統計を確認します。**
{% endstep %}
{% step %}
**ライブフィードの下で、Analytics > カメラ統計を選択します。デフォルトのタイムラインは7日間ですが、より長い期間の統計を確認するには、30日前まで変更できます。**
{% hint style="warning" %}
デフォルトのタイムラインは7日間です。拡張されたデータ傾向を表示するには、30日間まで延長できます。
{% endhint %}
{% endstep %}
{% endstepper %}
***
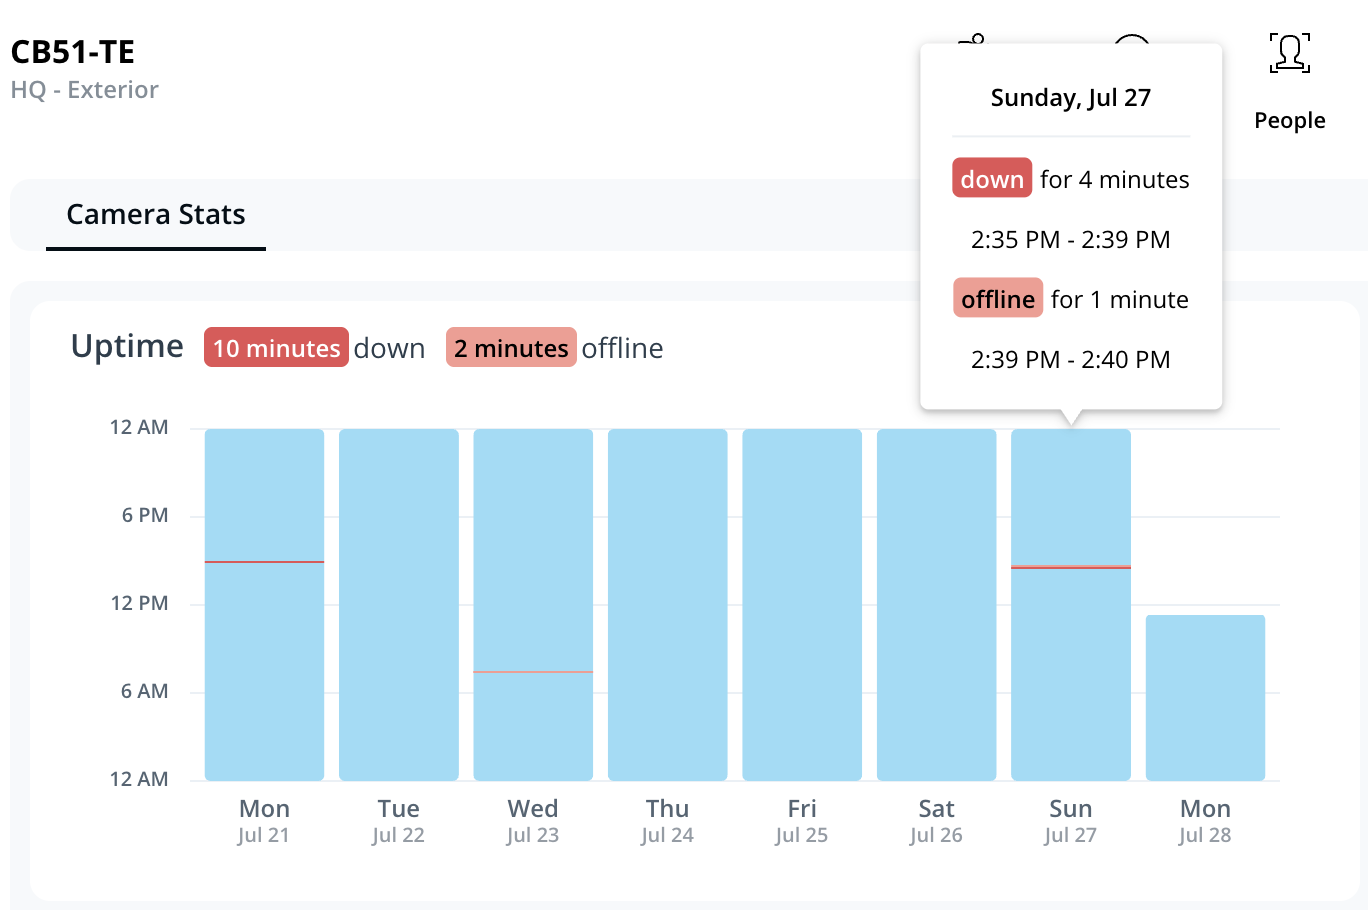
### カメラ稼働率
このグラフは、一定期間におけるカメラのVerkadaクラウドのステータスへの接続状況を示します。
* **青いバー -** カメラの電源がオンで、録画中かつVerkadaサーバーに接続されています
* **薄い赤いバー** - カメラの電源はオンで、録画中ですが、Verkadaサーバーには接続されていません
* **濃い赤いバー -** カメラの電源が入っておらず、録画もしていません
ほとんどの場合、稼働率とオンラインステータスは一致します。もし一致しない場合は、ローカルネットワークの問題を示している可能性があります(カメラには電源が入っていますが、クラウドに到達できません)。
タイムラインにカーソルを合わせると、特定のタイムスタンプと停止時間を表示できます。
***
### クラウドバックアップ
{% hint style="warning" %}
このグラフは、2025年7月3日UTC以降、カレンダービューで詳細データの表示を開始します。
{% endhint %}
このセクションでは、カメラのクラウドバックアップの進行状況の詳細ビューを表示します。内容は次のとおりです。
* クラウドに正常にバックアップされた映像の日数
* アップロード保留中のデータ量
* 現在の平均アップロード速度
* 次の内容を示す詳細なカレンダービュー:
* **薄い青いバー** - 前月または翌月から正常にバックアップされたデータ
* **濃い青いバー** - 選択した月から正常にバックアップされたデータ
* **ストライプのバー** - クラウドで利用できないデータ(カメラがオフラインで録画していないことが原因の可能性があります)
* **赤いバー** - アップロード保留中のデータ

***
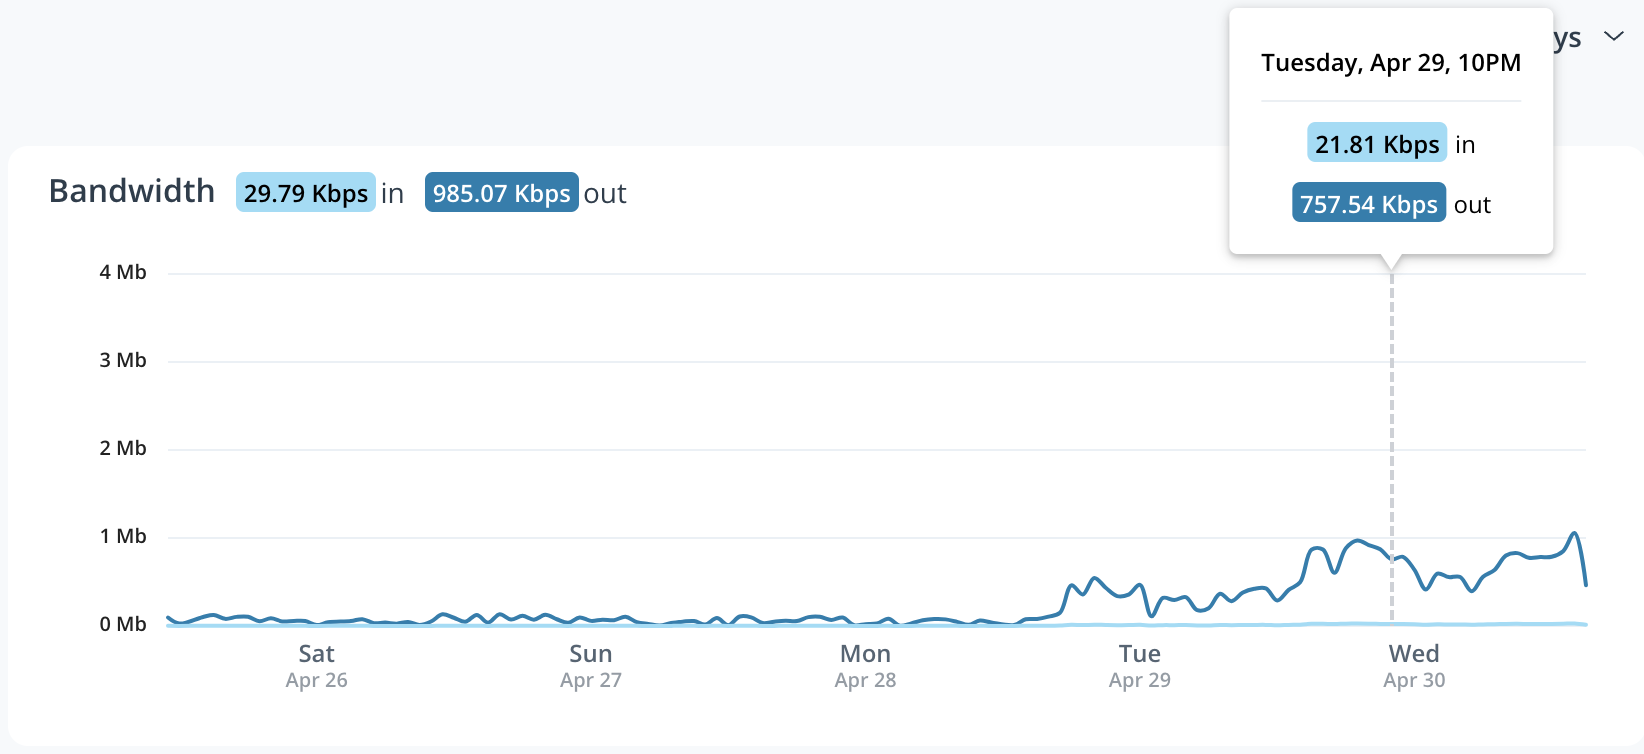
### 帯域幅
時間の経過に伴うアップロードとダウンロードの帯域幅速度(Kbps、Mbps、またはGbps)を追跡します。
* **受信トラフィック** は、カメラのダウンロードビットレートを示します。ファームウェアのダウンロード、設定変更、クラウドから送信されるコマンド(再起動要求など)がダウンロードビットレートに含まれます。
* **送信トラフィック** は、カメラのアップロードビットレートを示します。サムネイル、メタデータ、ストリーミングする、アーカイブ、クラウドバックアップがアップロードビットレートに含まれます。
***
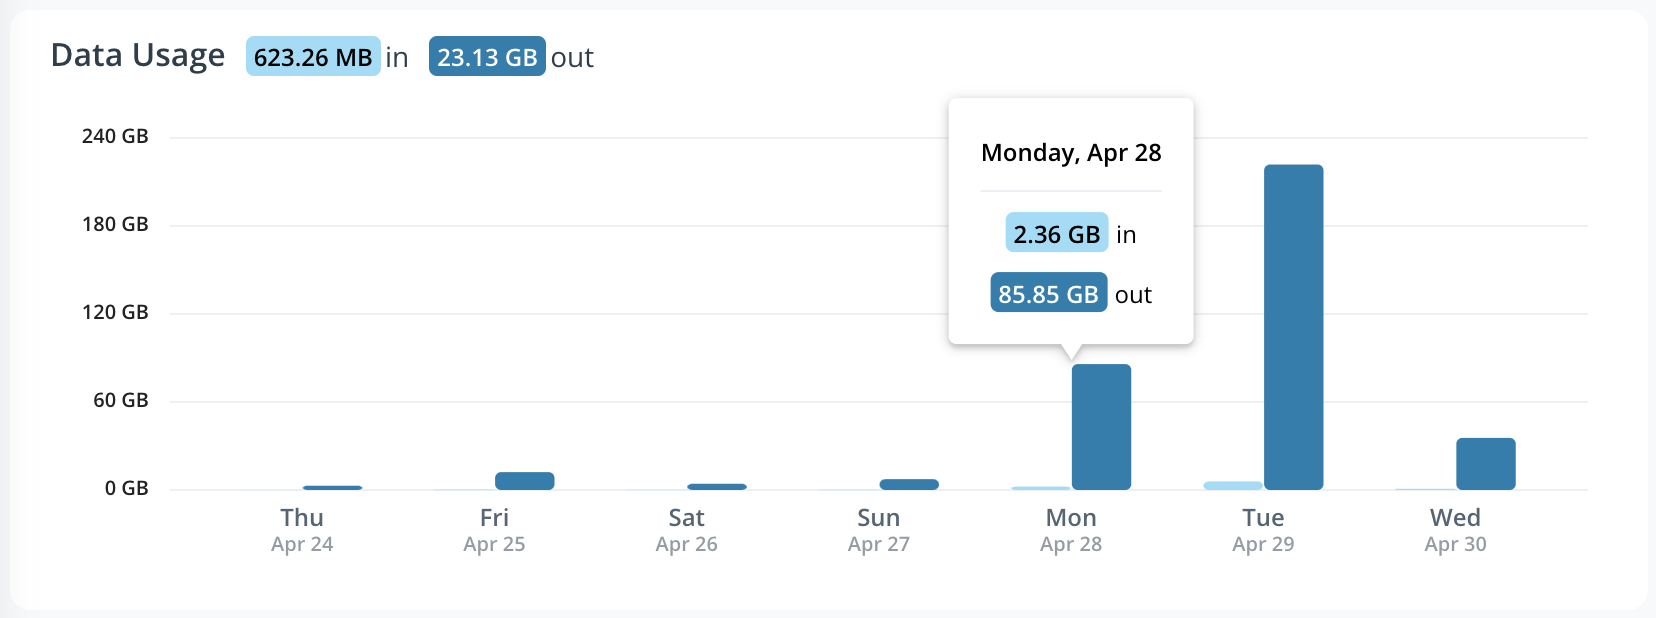
### データ使用量
このグラフは、一定期間に転送された合計データ量(KB、MB、またはGB)を示します。
* **受信データ** は、デバイスによってダウンロードされたデータ量を示します。ファームウェアのダウンロード、設定変更、クラウドから送信されるコマンド(再起動要求など)がこれに含まれます。
* **送信データ** は、デバイスによってアップロードされたデータ量を示します。サムネイル、メタデータ、ストリーミングする、アーカイブ、クラウドバックアップがこれに含まれます。
***
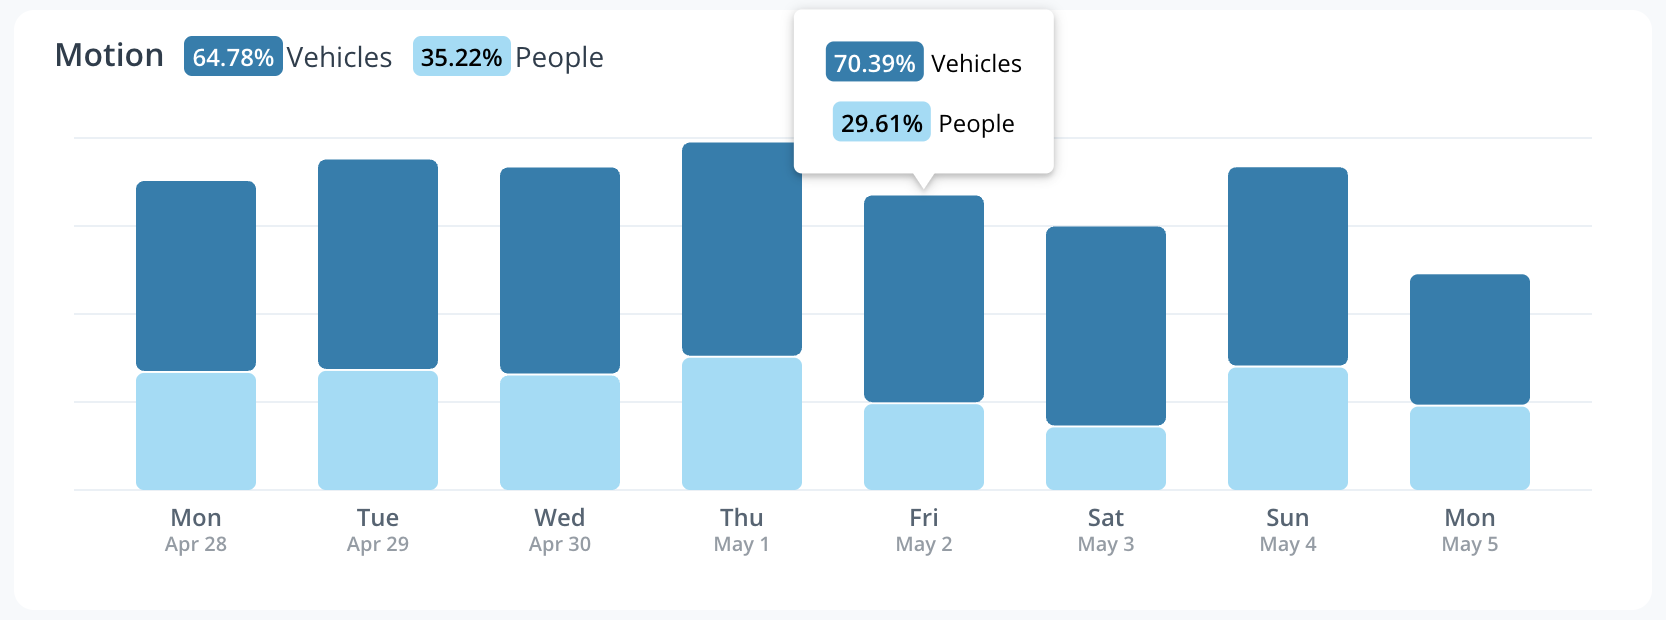
### モーションのアクティビティ
この **動体検知** タイムラインには、一定期間にフレーム内で検出されたモーションの量が表示されます。タイムラインにカーソルを合わせると、モーションに関連する統計を確認できます。
---
# Agent Instructions
This documentation is published with GitBook. GitBook is the documentation platform designed so that both humans and AI agents can read, navigate, and reason over technical content effectively. Learn more at gitbook.com.
## Querying This Documentation
If you need additional information that is not directly available in this page, you can query the documentation by asking a question.
Perform an HTTP GET request on the following URL with the `ask` and `goal` query parameters:
```
GET https://help.verkada.com/verkada-cameras/ja/fen-xi/camera-stats.md?ask=&goal=
```
`ask` is the immediate question: it should be specific, self-contained, and written in natural language.
`goal` is what the user is ultimately trying to achieve, the reason they need the answer. Sharing it helps GitBook give you a better, more relevant answer. A goal is most helpful when it describes the outcome the user wants rather than restating the question. For example, with `ask=how do I create an API token`, a goal like `automate deployments from our CI pipeline` lets GitBook tailor the answer to that use case.
The response will contain a direct answer to the question and relevant excerpts and sources from the documentation.
Use this mechanism when the answer is not explicitly present in the current page, you need clarification or additional context, or you want to retrieve related documentation sections.