> For the complete documentation index, see [llms.txt](https://help.verkada.com/llms.txt). Markdown versions of documentation pages are available by appending `.md` to page URLs; this page is available as [Markdown](https://help.verkada.com/verkada-cameras/ko/analytics/camera-stats.md).
# 카메라 통계
장치 분석을 확인하고 카메라 성능을 이해하세요
카메라 통계를 사용하여 다음 기능의 추이를 일정 기간 동안 확인할 수 있습니다:
* 카메라 가동 시간
* 클라우드 백업
* 대역폭 사용량
* 데이터 사용량
* 모션 활동
***
## 카메라 통계 모니터링
{% stepper %}
{% step %}
**Verkada Command에서 전체 제품 > 카메라로 이동합니다.**
{% endstep %}
{% step %}
**라이브 카메라 스트림을 보고 카메라 통계를 확인하려면 카메라를 선택하세요.**
{% endstep %}
{% step %}
**라이브 피드 아래에서 분석 > 카메라 통계를 선택하세요. 기본 타임라인은 7일이지만, 더 긴 기간의 통계를 보려면 최근 30일로 변경할 수 있습니다.**
{% hint style="warning" %}
기본 타임라인은 7일입니다. 더 긴 데이터 추세를 보려면 30일로 연장할 수 있습니다.
{% endhint %}
{% endstep %}
{% endstepper %}
***
### 카메라 가동 시간
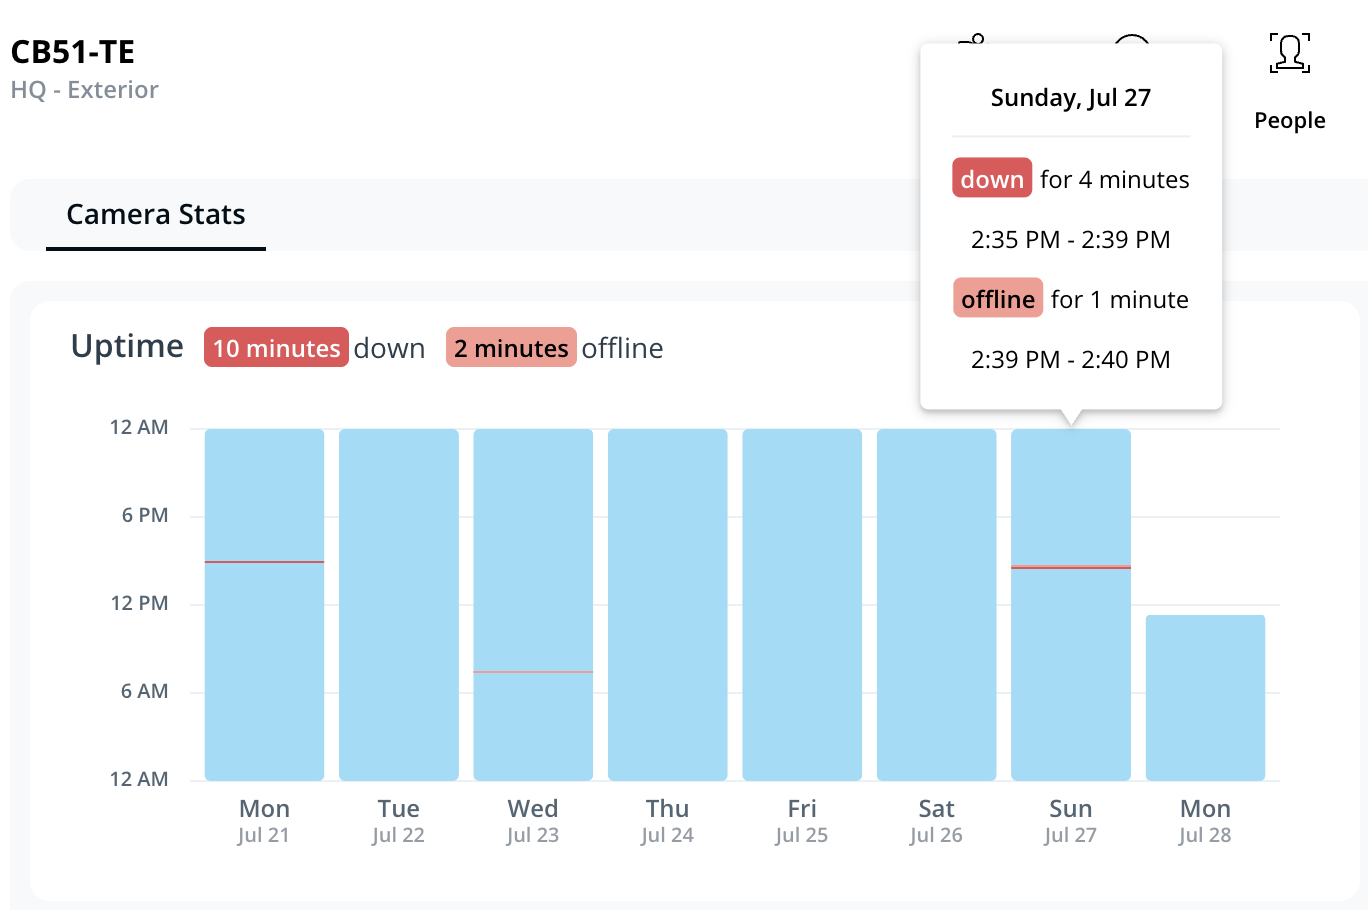
이 그래프는 일정 기간 동안 카메라의 Verkada 클라우드 연결 상태를 보여줍니다.
* **파란 막대 -** 카메라가 켜져 있고, 녹화 중이며, Verkada 서버에 연결되어 있습니다
* **연한 빨간 막대** - 카메라가 켜져 있고, 녹화 중이지만, Verkada 서버에는 연결되어 있지 않습니다
* **진한 빨간 막대 -** 카메라에 전원이 공급되지 않고 녹화도 하지 않습니다
대부분의 경우 가동 시간과 온라인 상태는 일치합니다. 일치하지 않는다면 로컬 네트워크 문제를 의미할 수 있습니다(카메라는 켜져 있지만 클라우드에 연결할 수 없음).
타임라인 위에 마우스를 올리면 특정 타임스탬프와 장애 지속 시간을 볼 수 있습니다.
***
### 클라우드 백업
{% hint style="warning" %}
이 그래프는 2025년 7월 3일 UTC부터 캘린더 보기에서 세부 데이터가 표시되기 시작합니다.
{% endhint %}
이 섹션에서는 카메라의 클라우드 백업 진행 상황을 자세히 보여줍니다. 여기에는 다음이 포함됩니다:
* 클라우드에 성공적으로 백업된 영상 일수
* 업로드 대기 중인 데이터 양
* 현재 평균 업로드 속도
* 다음 내용을 보여주는 상세 캘린더 보기:
* **연한 파란 막대** - 이전 또는 다음 달에서 성공적으로 백업된 데이터
* **진한 파란 막대** - 선택한 달에서 성공적으로 백업된 데이터
* **줄무늬 막대** - 클라우드에서 데이터를 사용할 수 없음(카메라가 오프라인 상태이고 녹화하지 않기 때문일 가능성이 큼)
* **빨간 막대** - 업로드 대기 중인 데이터

***
### 대역폭
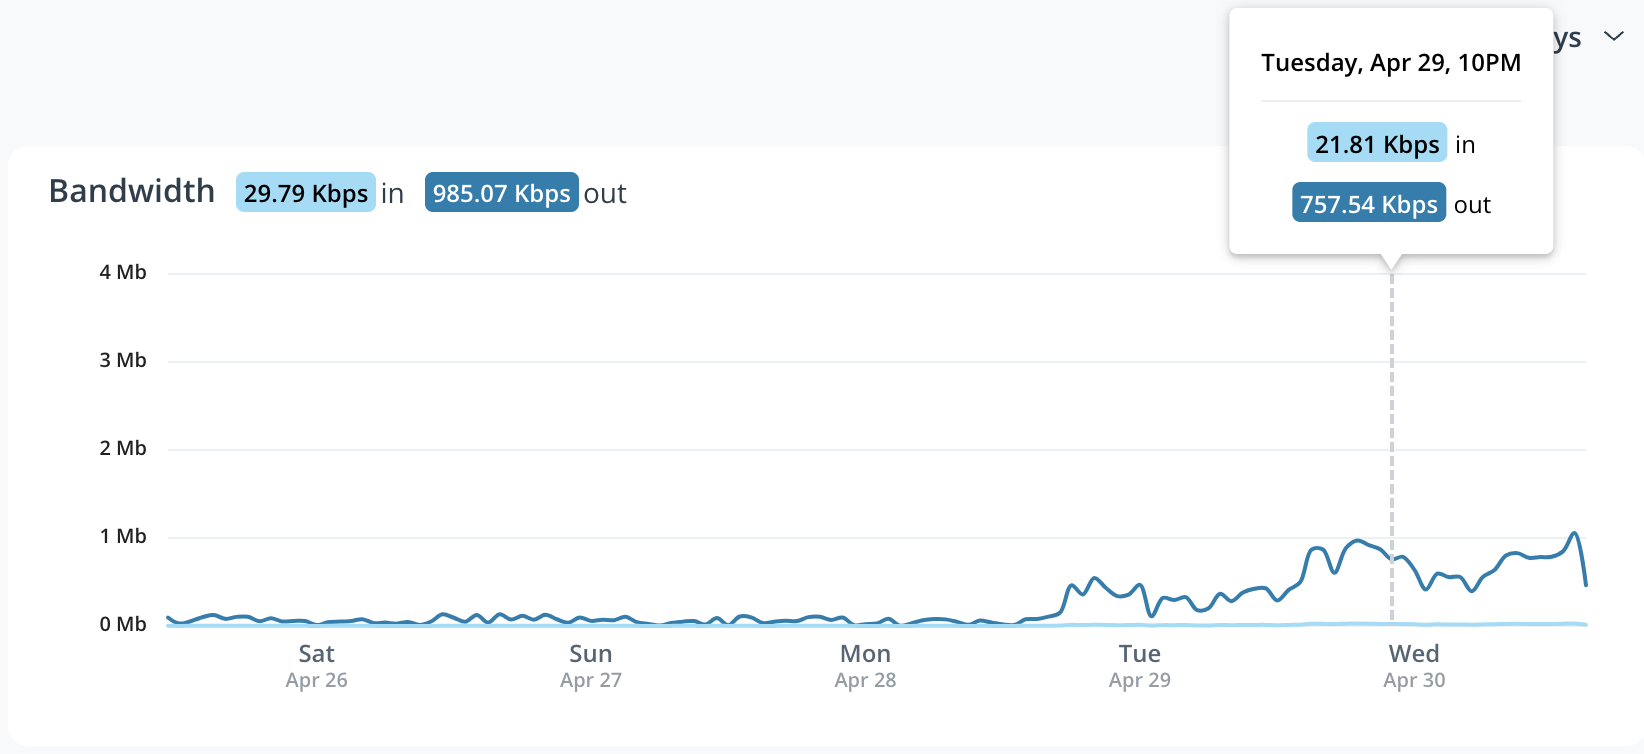
시간 경과에 따른 업로드 및 다운로드 대역폭 속도(Kbps, Mbps 또는 Gbps)를 추적합니다.
* **인바운드 트래픽** 는 카메라 다운로드 비트레이트를 나타냅니다. 펌웨어 다운로드, 구성 변경, 클라우드에서 전송된 명령(예: 재부팅 요청)이 다운로드 비트레이트에 영향을 줍니다.
* **아웃바운드 트래픽** 는 카메라 업로드 비트레이트를 나타냅니다. 썸네일, 메타데이터, 스트림, 아카이브, 클라우드 백업이 업로드 비트레이트에 영향을 줍니다.
***
### 데이터 사용량
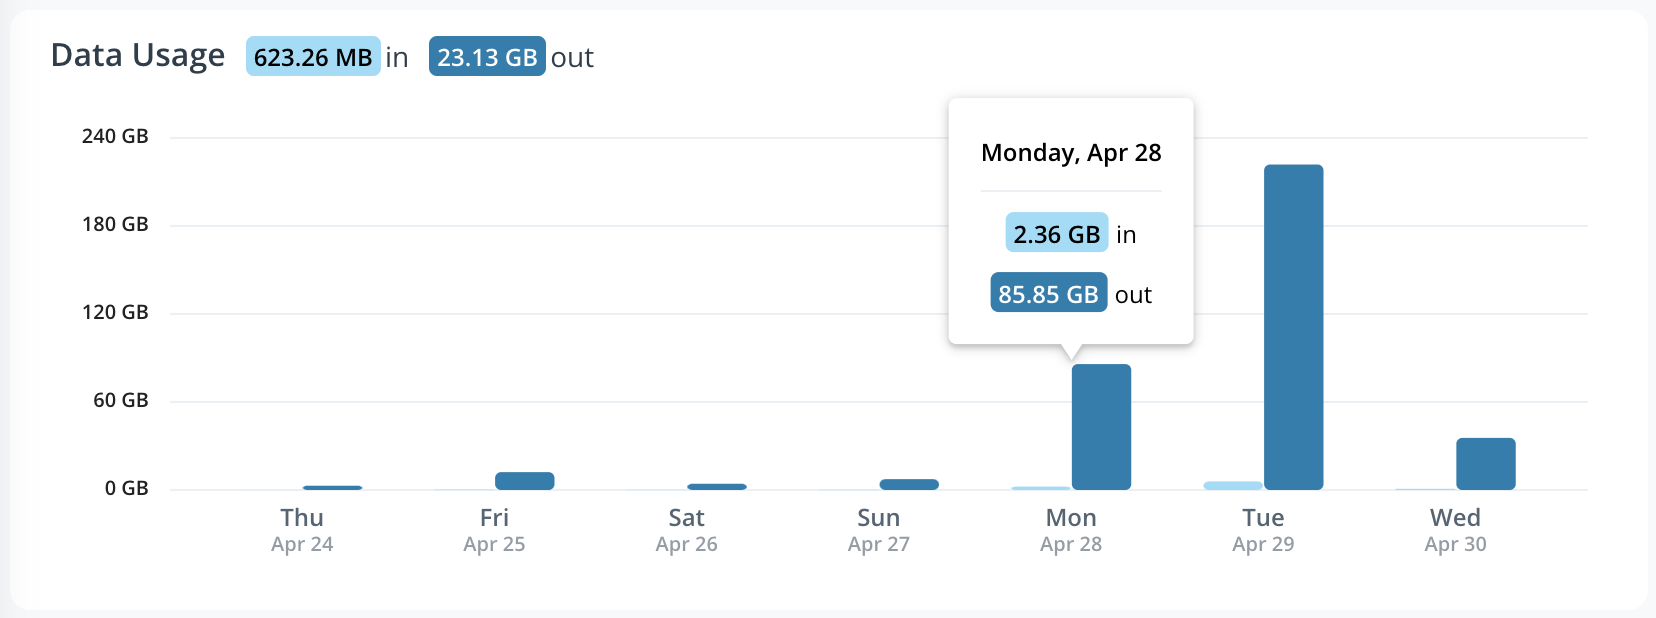
이 그래프는 일정 기간 동안 전송된 총 데이터 양(KB, MB 또는 GB)을 보여줍니다.
* **인바운드 데이터** 는 장치가 다운로드한 데이터 양을 나타냅니다. 펌웨어 다운로드, 구성 변경, 클라우드에서 전송된 명령(예: 재부팅 요청)이 이에 영향을 줍니다.
* **아웃바운드 데이터** 는 장치가 업로드한 데이터 양을 나타냅니다. 썸네일, 메타데이터, 스트림, 아카이브, 클라우드 백업이 이에 영향을 줍니다.
***
### 모션 활동
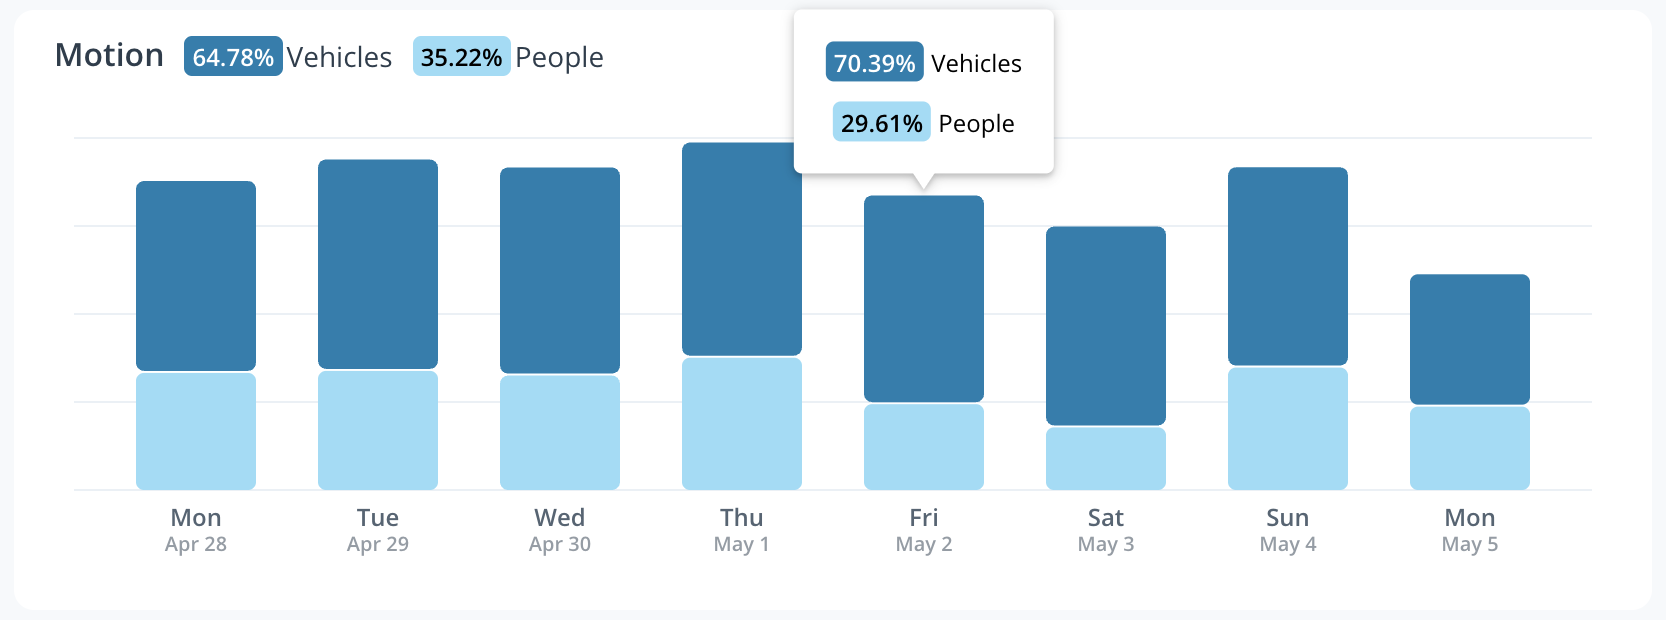
다음 **모션** 타임라인은 일정 기간 동안 프레임에서 감지된 모션의 양을 보여줍니다. 타임라인 위에 커서를 올리면 모션과 관련된 통계를 볼 수 있습니다.
---
# Agent Instructions
This documentation is published with GitBook. GitBook is the documentation platform designed so that both humans and AI agents can read, navigate, and reason over technical content effectively. Learn more at gitbook.com.
## Querying This Documentation
If you need additional information that is not directly available in this page, you can query the documentation by asking a question.
Perform an HTTP GET request on the following URL with the `ask` and `goal` query parameters:
```
GET https://help.verkada.com/verkada-cameras/ko/analytics/camera-stats.md?ask=&goal=
```
`ask` is the immediate question: it should be specific, self-contained, and written in natural language.
`goal` is what the user is ultimately trying to achieve, the reason they need the answer. Sharing it helps GitBook give you a better, more relevant answer. A goal is most helpful when it describes the outcome the user wants rather than restating the question. For example, with `ask=how do I create an API token`, a goal like `automate deployments from our CI pipeline` lets GitBook tailor the answer to that use case.
The response will contain a direct answer to the question and relevant excerpts and sources from the documentation.
Use this mechanism when the answer is not explicitly present in the current page, you need clarification or additional context, or you want to retrieve related documentation sections.