> For the complete documentation index, see [llms.txt](https://help.verkada.com/llms.txt). Markdown versions of documentation pages are available by appending `.md` to page URLs; this page is available as [Markdown](https://help.verkada.com/air-quality/ko/events-and-alerts/air-quality-event-analytics.md).
# 공기질 이벤트 분석
조직 전반의 Verkada 공기질 센서 알림 추세를 추적하고 모니터링하는 방법 알아보기
Verkada의 [대기질 센서](https://docs.verkada.com/docs/air-quality-sensors-overview.pdf) 비정상 상태를 자동으로 그리고 실시간으로 모니터링할 수 있는 기능을 제공하도록 설계되었습니다. 센서 분석을 통해 조직 전반에서 사이트 및 장치 수준의 경고 추세, 환경 추세, 그리고 동작을 추적하고 모니터링할 수 있습니다.
***
## 이벤트 분석에 액세스
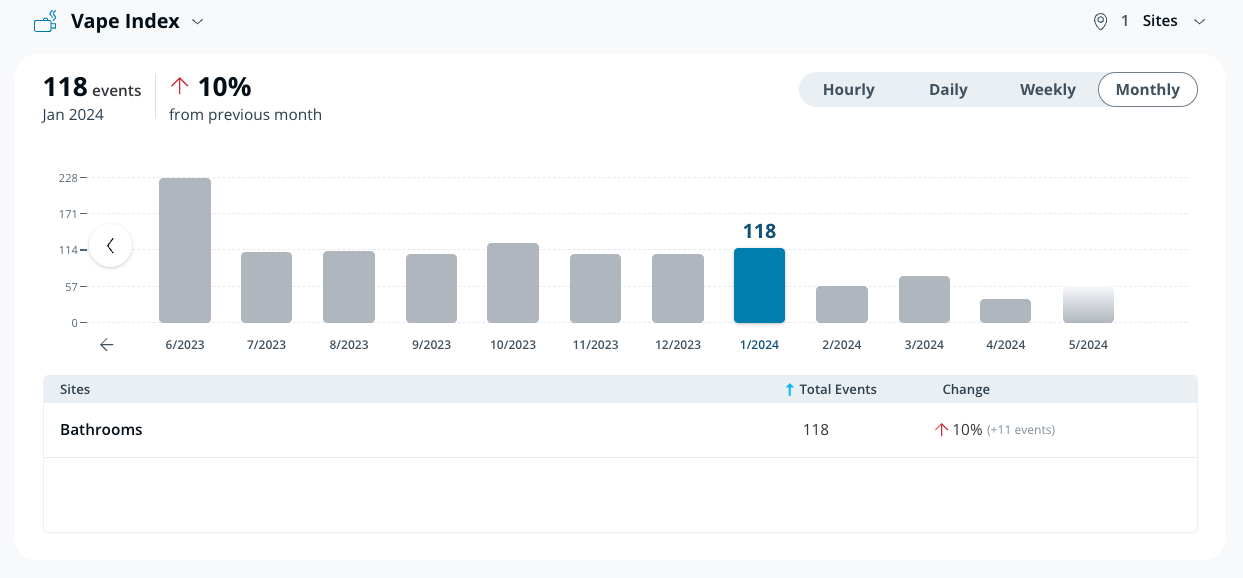
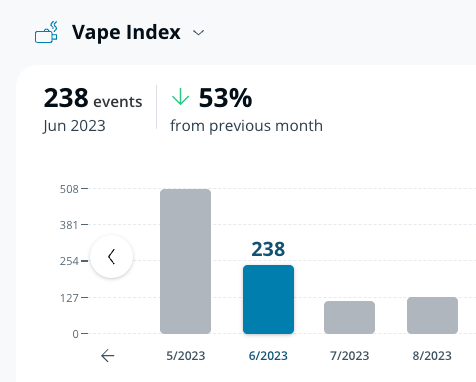
다음 **이벤트 분석** 페이지를 사용하면 센서 데이터를 더 쉽게 보고 분석할 수 있습니다. 이제 일별, 주별 또는 월별로 생성되는 경고 수를 확인하기 위해 평가할 판독값을 지정할 수 있습니다. 이 페이지에는 추세를 식별하는 데 도움이 되는 사용하기 쉬운 그래프와 총 경고 수 및 관련 변경 사항을 표시하는 표가 있습니다.
{% stepper %}
{% step %}
**Verkada Command에서 All Products > Air Quality로 이동합니다.**
{% endstep %}
{% step %}
**왼쪽 탐색 메뉴에서 분석을 클릭합니다.**
{% endstep %}
{% step %}
**이벤트 분석에서:**
a. 센서 판독값 드롭다운을 클릭하고 보려는 판독값을 선택합니다. 다음 항목 중에서 선택할 수 있습니다. [대기질 센서 판독값](/air-quality/ko/sensor-data/air-quality-sensor-readings.md) 사용 가능한 항목이지만, 구성되고 지원되는 장치의 경고만 데이터에 반영됩니다.\
b. 다음을 클릭합니다. **기간** 드롭다운(기본값은, **주간** 가 선택되어 있으며) 보고 싶은 기간을 선택합니다.
* **시간별**—선택한 날짜를 시간별로 보여줍니다.
* **일별**—지난 12일을 일별로 보여줍니다.
* **주간**—지난 12주를 주별로 보여줍니다.
* **월별**—지난 12개월을 월별로 보여줍니다.
g. 다음을 클릭합니다. **사이트** 드롭다운(기본값은, **모든 사이트** 가 선택되어 있으며), 검토할 사이트를 개별적으로 선택합니다. 사이트 내 장치의 일부에만 관심이 있다면 해당 장치를 위한 새 하위 사이트를 만드는 것을 권장합니다.
{% endstep %}
{% endstepper %}
### 분석 표 이해하기
상세 보기에서는:
* 선택한 사이트가 선택한 시간 간격 동안 이전 성과와 비교해 어떻게 수행했는지에 대한 분석을 볼 수 있습니다.
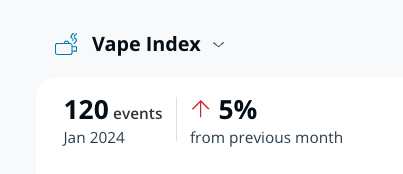
* 왼쪽 상단에는 선택한 시간 간격 동안 모든 선택한 사이트의 판독값에 대한 종합 요약이 표시됩니다. 분석할 새 센서 판독값을 선택할 수도 있습니다.
* 열 중 아무거나 활성 탭으로 선택할 수 있습니다.
* **총 경고** 는 선택한 기간 동안의 모든 경고 합계를 보여줍니다.
* 열 위와 페이지 왼쪽 상단의 요약 섹션에 있는 숫자는 **총 경고** 모든 사이트에 대한
* **변화** 는 선택한 기간에 상대적인 비율로 변화를 보여줍니다.
* 높은 **빨간색 위쪽 화살표** 는 측정 기간 동안 경고가 증가했음을 나타냅니다.
* 높은 **초록색 아래쪽 화살표** 는 측정 기간 동안 경고가 감소했음을 나타냅니다.
* 시간에 따른 변화가 없으면 0%로 표시됩니다.
* 참조 열에서 이벤트 수가 0인 상태에서 증가하는 경우는 정의되지 않음(0으로 나누기)으로 간주되며 –%로 표시됩니다.
* 경고는 시간이 지남에 따라 무한히 증가할 수 있으며, 2배 증가는 100% 변화에 해당합니다.
* 대부분의 경고는 시간이 지남에 따라 감소할 수 있으며, 감소율은 유한하고 0%로 수렴합니다. 2배 감소는 50% 변화에 해당합니다.
---
# Agent Instructions
This documentation is published with GitBook. GitBook is the documentation platform designed so that both humans and AI agents can read, navigate, and reason over technical content effectively. Learn more at gitbook.com.
## Querying This Documentation
If you need additional information that is not directly available in this page, you can query the documentation by asking a question.
Perform an HTTP GET request on the following URL with the `ask` and `goal` query parameters:
```
GET https://help.verkada.com/air-quality/ko/events-and-alerts/air-quality-event-analytics.md?ask=&goal=
```
`ask` is the immediate question: it should be specific, self-contained, and written in natural language.
`goal` is what the user is ultimately trying to achieve, the reason they need the answer. Sharing it helps GitBook give you a better, more relevant answer. A goal is most helpful when it describes the outcome the user wants rather than restating the question. For example, with `ask=how do I create an API token`, a goal like `automate deployments from our CI pipeline` lets GitBook tailor the answer to that use case.
The response will contain a direct answer to the question and relevant excerpts and sources from the documentation.
Use this mechanism when the answer is not explicitly present in the current page, you need clarification or additional context, or you want to retrieve related documentation sections.