> For the complete documentation index, see [llms.txt](https://help.verkada.com/llms.txt). Markdown versions of documentation pages are available by appending `.md` to page URLs; this page is available as [Markdown](https://help.verkada.com/air-quality/ja/ibento-arto/air-quality-event-analytics.md).
# 空気質イベント分析
組織全体のVerkada空気質センサーアラートの傾向を追跡およびモニターする方法を学ぶ
Verkadaの [空気質センサー](https://docs.verkada.com/docs/air-quality-sensors-overview.pdf) は、環境を異常な状態について自動的かつリアルタイムでモニターする機能を提供するように設計されています。センサー分析を使用すると、サイトおよびデバイスレベルで、組織全体のアラート傾向、環境傾向、行動を追跡およびモニターできます。
***
## アクセスイベント分析
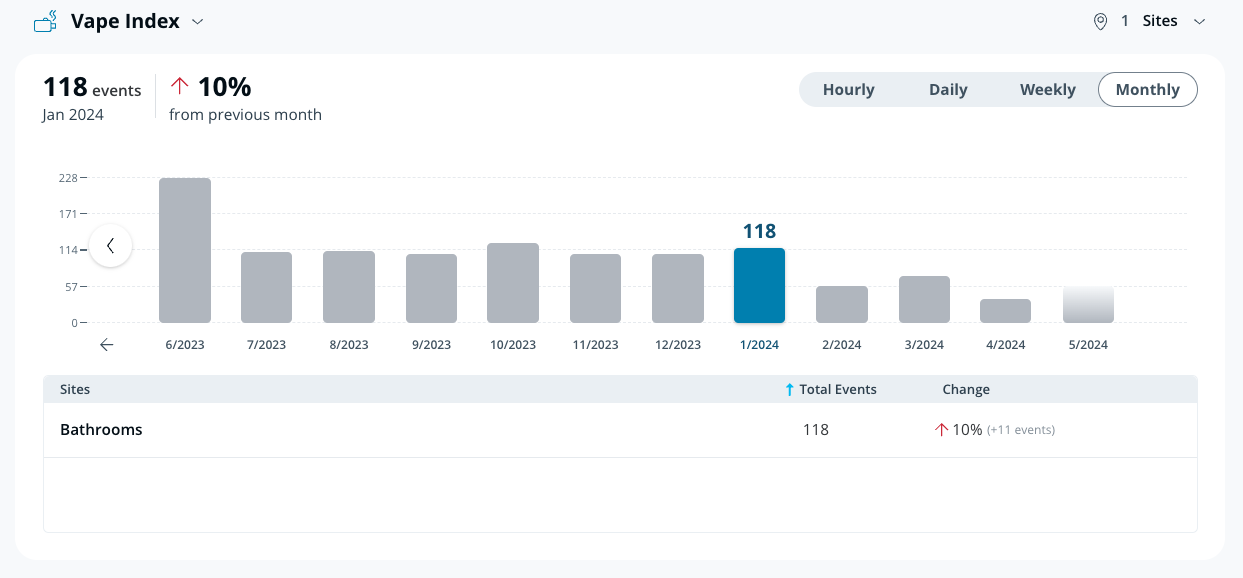
この **イベント分析** ページにより、センサーデータの表示と分析が容易になります。現在では、評価する読み取り値を指定して、1日、1週間、または1か月単位でどれだけのアラートが生成されるかを確認できます。このページには傾向を特定しやすくする見やすいグラフと、アラートの総数と関連する変化を表示する表があります。
{% stepper %}
{% step %}
**Verkada Commandで、All Products > 空気質に移動します。**
{% endstep %}
{% step %}
**左側のナビゲーションで、Analyticsをクリックします。**
{% endstep %}
{% step %}
**[Event Analytics]では:**
a. センサーの読み取り値のドロップダウンをクリックし、表示する読み取り値を選択します。次のいずれの [空気質センサーの読み取り値](/air-quality/ja/sensdta/air-quality-sensor-readings.md) 利用できます。ただし、データに反映されるのは、設定済みでサポートされているデバイスのアラートのみです。\
b. [ **期間** のドロップダウン(デフォルトでは、 **週単位** が選択されています)。表示する期間を選択します。
* **時間単位**—選択した日を1時間ごとに表示します。
* **日単位**—過去12日間を1日ごとに表示します。
* **週単位**—過去12週間を1週間ごとに表示します。
* **月単位**—過去12か月を1か月ごとに表示します。
g. [ **サイト** のドロップダウン(デフォルトでは、 **すべてのサイト** が選択されています)。確認したいサイトを個別に選択します。サイト内のデバイスの一部にのみ関心がある場合は、それらのデバイス用に新しいサブサイトを作成することをお勧めします。
{% endstep %}
{% endstepper %}
### 分析テーブルを理解する
詳細ビュー内では:
* 選択したサイトが、選択した時間間隔で前回のパフォーマンスと比較してどのような結果だったかの内訳が表示されます。
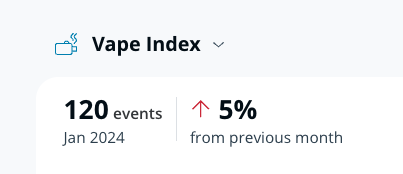
* 左上には、選択した時間間隔におけるすべての選択済みサイトの読み取り値の集計概要が表示されます。分析する新しいセンサー読み取り値を選択することもできます。
* 任意の列をアクティブなタブとして選択できます。
* **合計アラート** 選択した時間間隔におけるすべてのアラートの合計を示します。
* 列の上にある数値と、ページ左上の概要セクションにある数値は、 **合計アラート** すべてのサイトの合計です。
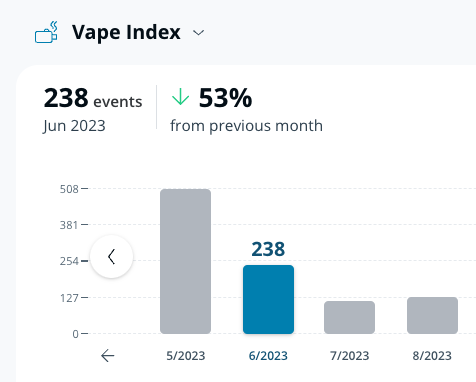
* **変化** は、選択した時間間隔に対する変化率をパーセンテージで示します。
* A **赤い上向き矢印** は、測定期間中のアラートの増加を示します。
* A **緑の下向き矢印** は、測定期間中のアラートの減少を示します。
* 時間経過による変化がない場合は 0% と表されます。
* 参照列のイベント数がゼロから増加する場合は未定義(ゼロ除算)と見なされ、–% と表されます。
* アラートが時間の経過とともに増加しうる最大値は無限で、2倍の増加は100%の変化に相当します。
* アラートのほとんどは時間の経過とともに減少しうるため、減少率は有限で0%に収束し、2倍の減少は50%の変化に相当します。
---
# Agent Instructions
This documentation is published with GitBook. GitBook is the documentation platform designed so that both humans and AI agents can read, navigate, and reason over technical content effectively. Learn more at gitbook.com.
## Querying This Documentation
If you need additional information that is not directly available in this page, you can query the documentation by asking a question.
Perform an HTTP GET request on the following URL with the `ask` and `goal` query parameters:
```
GET https://help.verkada.com/air-quality/ja/ibento-arto/air-quality-event-analytics.md?ask=&goal=
```
`ask` is the immediate question: it should be specific, self-contained, and written in natural language.
`goal` is what the user is ultimately trying to achieve, the reason they need the answer. Sharing it helps GitBook give you a better, more relevant answer. A goal is most helpful when it describes the outcome the user wants rather than restating the question. For example, with `ask=how do I create an API token`, a goal like `automate deployments from our CI pipeline` lets GitBook tailor the answer to that use case.
The response will contain a direct answer to the question and relevant excerpts and sources from the documentation.
Use this mechanism when the answer is not explicitly present in the current page, you need clarification or additional context, or you want to retrieve related documentation sections.